


Starting out in the world of stock trading can be an exciting, yet daunting experience. One of the most valuable tools in your journey as a trader is the stock chart. It is crucial to figure out how stock charts work is essential for making informed decisions and gaining insights into price movements.
If you’re a beginner, you may feel overwhelmed by the idea of analyzing charts, but don’t worry—this guide will break it down for you in simple terms.
Stock charts provide a clear visual representation of how a stock’s price has moved over a certain period. By interpreting these charts, you’ll learn to recognize trends, make predictions, and develop strategies to help you succeed in the market.
In this article, we’ll walk you through the fundamentals of stock charts, explain how to use them, and highlight key strategies that professional traders apply to make smart decisions.
What Are Stock Charts and Why Do You Need Them?
At their core, stock charts are graphical tools that display a stock’s price movements over time. They allow traders to analyze historical data, observe trends, and forecast where the stock may move next.
A well-constructed chart can reveal a wealth of information about a stock’s behavior in the market, helping traders predict future price actions and make decisions based on hard data, not just speculation.
For any beginner, learning how to read stock charts is an essential first step in becoming a successful trader. While charts may seem complex at first, they are designed to simplify the process of understanding the market.
When you gain a solid grasp of reading stock charts, you’ll have a powerful tool to help you make more informed decisions, manage risks, and identify potentially profitable trades.
Key Components of a Stock Chart
To effectively read and understand stock charts, it’s crucial to get familiar with the different components they contain. Let’s explore the most important elements that make up a stock chart and how they can help you analyze a stock’s performance.
Price and Volume: The Core of the Chart
Every stock chart displays two key pieces of data: price and volume. The price represents how much a stock is worth at any given moment, while the volume shows how many shares of that stock have been traded. These two factors go hand-in-hand and can give you a better understanding of the strength or weakness of a stock’s movement.
Example: Let’s say a stock drops 3% in a single day. If the volume is low, it could mean that the price movement is not backed by a lot of selling pressure, and the stock may recover soon. However, if the volume is unusually high, it might indicate that the downtrend has more momentum and could continue for a while.
Moving Averages: Tracking the Stock’s Average Price
A moving average is a tool used to smooth out fluctuations in stock prices by calculating the average price over a specific period, such as 50 days or 200 days. This indicator helps you identify the stock’s overall trend.
When the stock price is above the moving average, it suggests an uptrend, and when it falls below, it signals a downtrend.
Example: If a stock consistently stays above its 200-day moving average, it typically indicates that the stock is in a long-term uptrend. Conversely, if the stock starts dipping below this line, it may be an early sign that the trend is reversing.
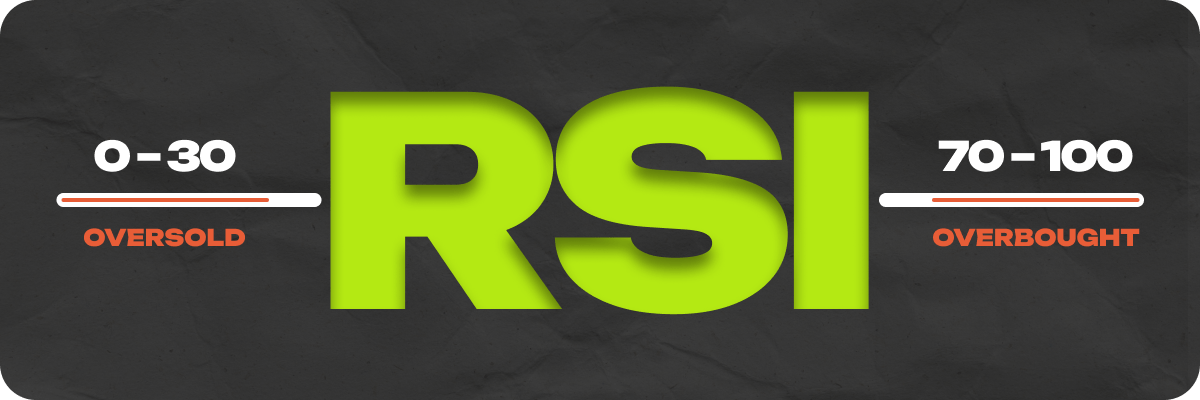
Relative Strength Index (RSI): Spotting Overbought and Oversold Conditions
The RSI is a momentum oscillator that measures whether a stock is overbought or oversold. The RSI ranges from 0 to 100, with levels above 70 suggesting that a stock is overbought (and may be due for a price correction) and levels below 30 indicating that the stock is oversold (and could be a potential buying opportunity).
Example: If a stock’s RSI shoots above 70, it’s a signal that the stock might be overbought, and a price decline could be imminent. If the RSI drops below 30, the stock may be undervalued and could present an opportunity to buy before the price rises again.
How to Read Stock Charts: A Step-by-Step Process
Now that you know the key elements of a stock chart, let’s walk through the process of reading and analyzing one.
1. Understand the Axes: Time and Price
Every stock chart has two axes:
- The horizontal (X) axis represents time, which could range from minutes to years, depending on the chart’s settings.
- The vertical (Y) axis represents the stock’s price.
By analyzing both axes, you can visualize the relationship between the price and the time frame. For instance, a chart showing daily data will help you track price changes day by day, while a chart showing monthly data will give you a broader view of longer-term trends.
2. Observe the Trend Lines
Trend lines are lines drawn on the chart to identify the overall direction of a stock’s price. These lines help you see whether the stock is trending upwards, downwards, or sideways. Traders use trend lines to make decisions about buying, selling, or holding a stock.
There are different types of charts you can use to view trend lines:
- Line charts: Simple and clear, showing the closing price over time.
- Candlestick charts: More detailed, showing the opening, closing, highest, and lowest prices for each time period. Candlesticks can provide more information about market sentiment.
- Bar charts: Similar to candlesticks but with a different format.
As a beginner, you may want to start with a line chart, as it’s easy to read. As you gain more experience, you can experiment with candlestick or bar charts to uncover additional insights.
3. Identify Support and Resistance Levels
Support and resistance are fundamental concepts in technical analysis. These levels represent price points where stocks tend to bounce or reverse direction.
- Support: A price level where a stock tends to find buying interest and is unlikely to fall below.
- Resistance: A price level where a stock faces selling pressure and is unlikely to rise above.
Recognizing these levels can help you decide when to buy (near support) or sell (near resistance). Stocks often fluctuate between these levels, so spotting them early can give you a strategic advantage.
Trading Strategies with Stock Charts: Insights from Professionals
Experienced traders use stock charts in a variety of ways to formulate strategies. Here are some of the key strategies they apply:
Trend Following
One of the most straightforward approaches is to follow the trend. When a stock is in an uptrend (higher highs and higher lows), traders typically buy, hoping the trend will continue. Conversely, when a stock is in a downtrend, traders may look for opportunities to sell or short.
Example: If a stock shows a consistent uptrend, a trader might wait for a pullback to buy, aiming to ride the trend higher.
Breakouts and Breakdowns
Breakouts happen when a stock’s price breaks above a resistance level, indicating potential for a strong upward movement. Breakdowns, on the other hand, occur when the price falls below support, suggesting a possible downward trend. Traders look for these key price movements to enter trades.
Example: A stock that breaks above resistance with high volume could signal the start of a new bullish trend, prompting traders to buy.
Reversal Patterns
Traders also look for reversal patterns (such as the head-and-shoulders pattern or double tops and bottoms) to predict when a trend might change direction. Recognizing these patterns early allows traders to capitalize on price reversals.
Essential Tools for Beginners
To start trading with stock charts, you’ll need the right tools to make your analysis effective. Here are a few key tools that every beginner should have:
- Charting Software. Platforms like TradingView, MetaTrader, and ThinkorSwim are excellent choices for beginners. These platforms provide real-time data, charting tools, and indicators to help you analyze stocks.
- Technical Indicators. In addition to the basics (like moving averages and RSI), you may also want to explore other indicators such as MACD or Bollinger Bands to deepen your analysis.
- News and Market Data. Stay updated with the latest news, earnings reports, and economic events that might influence stock prices. Many charting platforms integrate news feeds, so you’ll always be informed.
Conclusion
Mastering stock charts is a critical step in becoming a successful trader. Once you understand the basics — such as price, volume, moving averages, and support/resistance levels — you’ll be able to make more informed decisions and develop strategies based on data, not guesswork.
While it may take time to become proficient, don’t be discouraged. As you gain experience, reading stock charts will become second nature. With the right tools, strategies, and a solid understanding of chart analysis, you’ll be well on your way to navigating the stock market with confidence.
