


In the fast-moving world of Forex trading, decisions must often be made in a matter of seconds. While many traders pay close attention to economic data and global events, another powerful approach relies entirely on one element: price. This is the foundation of technical analysis, a method used to make sense of price movements by examining patterns and behaviors visible on a chart.
Whether you’re just starting out or exploring ways to improve your trading decisions, understanding technical analysis is a vital step in your journey. This guide aims to give you a clear, beginner-friendly foundation in how it works, why it’s effective, and how to begin applying it with confidence.
What Is Technical Analysis?
Technical analysis is the study of historical price movement to anticipate future price direction. It’s based on the idea that markets are driven by supply and demand, and that this dynamic creates trends, patterns, and recurring behaviors. All of these can be observed through charts.
Rather than trying to predict markets by evaluating economic performance, political developments, or corporate earnings reports—as fundamental analysts do—technical analysts focus on what’s already happened in the market. They believe that price reflects everything that’s known and felt by market participants, from central bank policies to emotional reactions like fear and greed.
This makes technical analysis not only a method of forecasting but also a way of reading the collective psychology of the market.
Why Technical Analysis Matters for Forex Traders
The Forex market is the most liquid and one of the most volatile financial markets in the world. Currencies can move in reaction to anything from interest rate announcements to global news. In this environment, technical analysis becomes a crucial tool because it provides structure.
Instead of reacting emotionally or making guesses, traders use charts and patterns to make calculated decisions based on what the market is showing them in real time. This approach is especially useful in Forex, where price action can be extremely fast and where economic reports come thick and fast from around the globe.
Moreover, since the market is always open and influenced by different regions and time zones, technical analysis allows traders to work with consistency and objectivity, regardless of when they’re trading.
The Logic Behind Technical Analysis: Price, Patterns, and Psychology
At its core, technical analysis is not about predicting the future with certainty. It’s about recognizing probabilities. Traders study past price data to spot patterns that tend to repeat themselves. The reason they repeat is because market participants often react similarly to similar situations.
For example, when traders fear inflation is rising, they may react by selling a currency perceived as weak, such as the Japanese yen. When enough traders do this, it creates a visible downtrend on a price chart. Over time, these types of reactions become recognizable, and technical analysts look for these patterns to take advantage of likely outcomes.
Technical analysis also assumes that price moves in trends. Trends can be upward, downward, or sideways (ranging). A trend is more than just a price moving in one direction—it’s a sign of how sentiment is evolving over time.
Another important concept is support and resistance. These are price levels where buying or selling pressure has historically been strong enough to stop or reverse a trend. Traders often look for these levels to time entries or exits with greater precision.
How to Use Technical Analysis in Practice
The first step is learning to read price charts. Most traders use candlestick charts, which offer detailed information about price movements within specific timeframes. Each candle shows where price opened, closed, and how high or low it went during that period. Candlestick formations also offer clues about momentum and potential reversals.
Beyond candlesticks, traders often draw trendlines or use channels to identify direction and momentum. These are visual aids that connect price points to highlight whether the market is trending or consolidating.
A major part of technical analysis is recognizing patterns—not random shapes, but recurring behaviors. For instance, the “double top” pattern often signals a market turning from bullish to bearish, while a “triangle” formation suggests an upcoming breakout, though the direction may require further confirmation.
Traders also use indicators, which are mathematical calculations based on price, volume, or both. These indicators can help confirm what the chart is showing. For example, the Relative Strength Index (RSI) can reveal whether a currency pair is overbought or oversold, and the Moving Average Convergence Divergence (MACD) helps identify shifts in momentum.
However, these tools are not infallible. They should be seen as decision aids, not decision makers. Many professionals emphasize the importance of context—an indicator may suggest an entry, but without trend alignment or price structure to support it, the signal may be weak or misleading.
Real-World Use: How Professionals Apply Technical Analysis
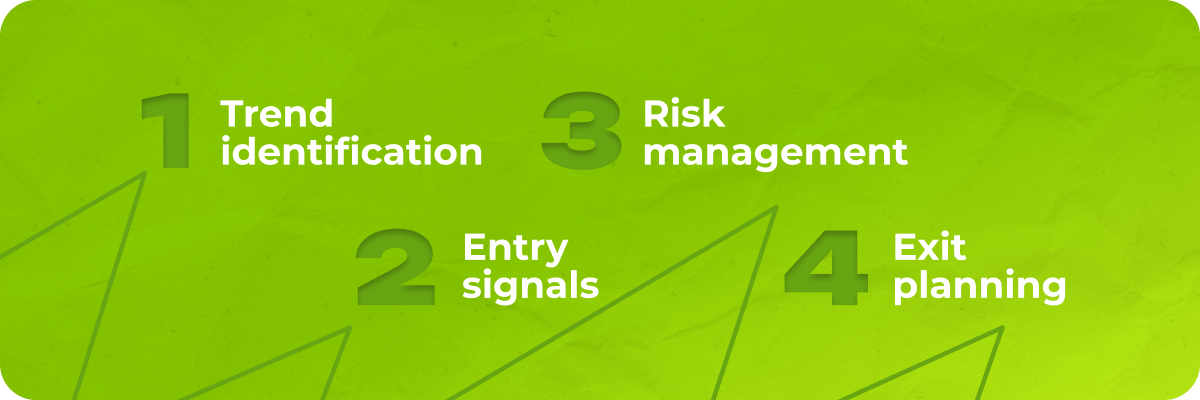
Professional traders treat technical analysis as part of a larger process. They don’t rely on one signal or tool. Instead, they develop structured strategies based on a combination of:
- Trend identification (e.g., using moving averages to determine market direction)
- Entry signals (e.g., a breakout from a key level or a candlestick reversal pattern)
- Risk management (e.g., stop-loss orders based on recent swing highs/lows)
- Exit planning (e.g., exiting at resistance or using trailing stops)
Most experienced traders also use backtesting, a process that tests how a trading strategy would have performed in the past. This helps them refine their strategy and understand how it behaves under different market conditions. While past performance doesn’t guarantee future results, it provides valuable insight into the potential reliability of a system.
Some traders also combine technical and fundamental analysis. For instance, a trader might use economic data to choose which currency pair to trade, but rely on technical patterns to time the trade precisely. This balanced approach can be powerful, as it incorporates both market sentiment and broader context.
What Beginner Traders Should Know Before Starting
For those just getting started, the amount of information can feel overwhelming. The key is to start simple and focus on mastering the basics. Instead of trying to learn every indicator or pattern at once, focus on understanding:
- How trends form and how to identify them
- The importance of support and resistance levels
- A few basic candlestick patterns that signal reversals or continuations
- How to apply one or two indicators as confirmation, not as decision-makers
Equally important is risk management. No technical setup is perfect, and every trader experiences losses. The difference between successful and unsuccessful traders often comes down to how well they manage their risk. Never trade without a stop-loss, and always know how much of your account you’re willing to risk on a single trade.
Using a demo account to practice is another essential step. It allows you to test strategies and build confidence without financial risk. This also helps you learn the rhythm of the market—how price behaves during different sessions, how news affects volatility, and how your emotions respond to wins and losses.
Final Thoughts: Learning to Think Like a Technical Trader
Technical analysis isn’t just a set of tools—it’s a way of thinking. It teaches you to approach the markets with structure, discipline, and data. Instead of guessing where price might go, you’re learning to follow the market’s clues and act with reason.
For beginners, technical analysis opens the door to becoming more confident and independent traders. While it won’t guarantee profits, it will help you make smarter, more informed decisions—and over time, that’s what builds long-term success.
As you grow in your understanding, you’ll begin to trust your chart reading more, rely less on others’ opinions, and gain the confidence to build and follow your own trading plan.
Remember, becoming proficient in technical analysis is a journey—not a race. Study the charts. Learn from your trades. And above all, remain patient and persistent. The markets will always be there. What matters is your ability to understand and navigate them.
